A modern, browser-based frontend to gdb (gnu debugger). Add breakpoints, view stack traces, and more in C, C++, Go, and Rust! Simply run
gdbgui from the terminal and a new tab will open in your browser. Install
[sudo] pip install gdbgui --upgradeRun
gdbgui [binary to debug]Features
- Debug a different program in each tab (new gdb instance is spawned for each tab)
- Set/remove breakpoints
- View stack, threads
- Switch frame on stack, switch between threads
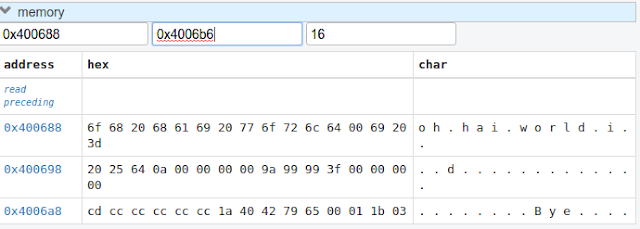
- Inspect memory in hex/character form
- View all registers
- Dropdown of all files used to compile binary, with autocomplete functionality
- Source code explorer with ability to jump to line
- Show assembly next to source code, highlighting current instruction. Can also step through instructions.
Why gdbgui?
- Actively developed and compatible with the latest version of gdb (7.12)
- Does only one thing: debugs programs. No integrated build system, no project settings, nothing to make things more complicated than they need to be. Just a lightweight frontend.
- Design influenced by the amazing Chrome debugger: source code on the left, side panel on the right with collapsable widgets, console on the bottom
- Full gdb command line utility built in
- Written in widely used languages (Python and JavaScript)
- Open source and free
See https://github.com/cs01/gdbgui/tree/master/examples
Arguments
- Positional arguments:
command: (Optional) The binary and arguments to run in gdb. This is a way to script the intial loading of the inferior binary you wish to debug. For examplegdbgui ./mybinary -myarg -flag1 -flag2. Binaries and arguments can also be input through the browser interface after launching.- Flags (all are optional):
-h, --help show this help message and exit -p PORT , --port PORT The port on which gdbgui will be hosted --host HOST The host ip address on which gdbgui serve. -g GDB , --gdb GDB Path to gdb executable or lldb-mi executable. Defaults is 'gdb'. lldb support is experimental and not fully functional at this time. -v, --version Print version --debug The debug flag of this Flask application. Pass this flag when debugging gdbgui itself to automatically reload the server when changes are detected -n, --no_browser By default, the browser will open with gdb gui. Pass this flag so the browser does not open.
Compatibility
Python versions: 2.7, 3.4, 3.5, pypy
Operating systems: Ubuntu 14.04, Ubuntu 16.04, OSX
Browsers: Chrome, Firefox, Ubuntu Web Browser
Gdb: 7.7.1 (tested), 7.12 (tested), likely works with intermediate versions
How Does it Work?
It uses Python to manage gdb as a subprocess. Specifically, the pygdbmi library , which returns key/value pairs (dictionaries) that can be used to create a frontend. To make a usable frontend, first a server must made to interface with gdb. In this case, the Flask server is used, which does three things: creates a managed gdb subprocess with pygdbmi, spawns a separate thread to constantly check for output from the gdb subprocess, and creates endpoints for the browser including http requests and websocket connections.
As output is parsed in the reader thread, it is immediately sent to the frontend through the websocket. As the browser receives these websocket messages, it maintains the state of gdb (whether it's running, paused, or exited, where breakpoints are, what the stack is, etc.) and updates the DOM as appropriate. The browser also sends commands to gdb through a websocket to Flask server, which then passes the command to gdb. Gdb writes new output, which is picked up by the reader thread.
gdbgui was designed to be easily hackable and extendable. There is no build system necessary to run or develop this app. The main components of gdbgui are
-
backend.py: The backend consists of a single Python file, which makes use of pygdbmi to interact with a gdb subprocess, and Flask to set up url routing, websockets, and http responses. -
gdbgui.pug: HTML file that defines the frontend -
gdbgui.js: The majority of the application is contained in this file. It dynamically updates the page, and maintains gdb state. It sends AJAX requests and uses websockets to interact with gdb through the server, then gets the response and updates the DOM as necessary. -
gdbgui.css: css stylesheet
Screenshots
Enter the binary and args just as you'd call them on the command line. Binary is restored when gdbgui is opened at a later time.
Intuitive control of your program. From left to right: Run, Continue, Next, Step, Return, Next Instruction, Step Instruction, send interrupt signal (SIGINT) to inferior process.
Stack/Threads
View all threads, the full stack on the active thread, the current frame on inactive threads. Switch between frames on the stack, or threads by pointing and clicking.
Source Code
View source, assembly, add breakpoints. All symbols used to compile the target are listed in a dropdown above the source code viewer, and have autocompletion capabilities.
With assembly. Note the bold line is the current instruction that gdb is stopped on.
Variables and Expressions
All local variables are automatically displayed, and are clickable to explore their fields.
Arbitrary expressions can be evaluated as well.
Expressions record their previous values, and can be displayed in an x/y plot.
Memory Viewer
All hex addresses are automatically converted to clickable links to explore memory. Length of memory is configurable. In this case 16 bytes are displayed per row.
Registers
View all registers. If a register was updated it is highlighted in yellow.
gdb console
Read gdb output, and write to the gdb subprocess as desired. Don't let any gdb commandline skills you've developed go to waste.
gdbgui at launch:


