This is default featured slide 1 title

Go to Blogger edit html and find these sentences.Now replace these sentences with your own descriptions.

This is default featured slide 2 title

Go to Blogger edit html and find these sentences.Now replace these sentences with your own descriptions.

This is default featured slide 3 title

Go to Blogger edit html and find these sentences.Now replace these sentences with your own descriptions.

This is default featured slide 4 title

Go to Blogger edit html and find these sentences.Now replace these sentences with your own descriptions.

This is default featured slide 5 title

Go to Blogger edit html and find these sentences.Now replace these sentences with your own descriptions.

Showing posts with label Debugging. Show all posts

Cameradar - An RTSP Surveillance Camera Access Multitool


Cameradar hacks its way into RTSP CCTV cameras

Cameradar allows you to:
  • Detect open RTSP hosts on any accessible target
  • Get their public info (hostname, port, camera model, etc.)
  • Launch automated dictionary attacks to get their stream route (for example /live.sdp)
  • Launch automated dictionary attacks to get the username and password of the cameras
  • Generate thumbnails from them to check if the streams are valid and to have a quick preview of their content
  • Try to create a Gstreamer pipeline to check if they are properly encoded
  • Print a summary of all the informations Cameradar could get

And all of this in a single command-line.
Of course, you can also call for individual tasks if you plug in a Database to Cameradar using the MySQL cache manager for example. You can create your own cache manager by following the simple example of the dumb cache manager.

Quick install
The quick install uses docker to build Cameradar without polluting your machine with dependencies and makes it easy to deploy Cameradar in a few commands. However, it may require networking knowledge, as your docker containers will need access to the cameras subnetwork.

Dependencies
The only dependencies are docker, docker-tools, git and make.

Five steps guide
  1. git clone https://github.com/EtixLabs/cameradar.git
  2. cd cameradar/deployment
  3. Tweak the conf/cameradar.conf.json as you need (see the configuration guide here for more information)
  4. docker-compose build ; docker-compose up
By default, the version of the package in the deployment should be the last stable release.
If you want to scan a different target or different ports, change the values CAMERAS_TARGET and CAMERAS_PORTS in the docker-compose.yml file.
The generated thumbnails will be in the cameradar_thumbnails folder after Cameradar has finished executing.
If you want to deploy your custom version of Cameradar using the same method, you should check the advanced docker deployment tutorial here.

Manual installation
The manual installation is recommended if you want to tweak Cameradar and quickly test them using CMake and running Cameradar in command-line. If you just want to use Cameradar, it is recommended to use the quick install instead.

Dependencies
To install Cameradar you will need these packages
  • cmake (cmake)
  • git (git)
  • gstreamer1.x (libgstreamer1.0-dev)
  • ffmpeg (ffmpeg)
  • boost (libboost-all-dev)
  • libcurl (libcurl4-openssl-dev)

Steps
The simplest way would be to follow these steps :
  1. git clone https://github.com/EtixLabs/cameradar.git
  2. cd cameradar
  3. mkdir build
  4. cd build
  5. cmake ..
  6. make
  7. cd cameradar_standalone
  8. ./cameradar -s the_target_you_want_to_scan

Output
For each camera, Cameradar will output these JSON objects :
{
"address" : "173.16.100.45",
"ids_found" : true,
"password" : "123456",
"path_found" : true,
"port" : 554,
"product" : "Vivotek FD9381-HTV",
"protocol" : "tcp",
"route" : "/live.sdp",
"service_name" : "rtsp",
"state" : "open",
"thumbnail_path" : "/tmp/127.0.0.1/1463735257.jpg",
"username" : "admin"
}

Check camera access
If you have VLC Media Player, you should be able to use the GUI to connect to the RTSP stream using this format : rtsp://username:password@address:port/route
With the above result, the RTSP URL would be rtsp://admin:123456@173.16.100.45:554/live.sdp
If you're still in your console however, you can go even faster by using vlc in commmand-line and just run vlc rtsp://username:password@address:port/route with the camera's info instead of the placeholders.

Command line options
  • "-c" : Set a custom path to the configuration file (-c /path/to/conf) <<<<<<< HEAD
  • "-s" : Set custom subnets (overrides configuration) : You can use this argument in many ways, using a subnet (e.g.: 172.16.100.0/24) or even an IP (e.g.: 172.16.100.10), a range of IPs (e.g.: 172.16.100.10-172.16.100.20) or a mix of all those (e.g.: 172.17.100.0/24,172.16.100.10-172.16.100.20,0.0.0.0). =======
  • "-s" : Set custom target (overrides configuration)
  • "-p" : Set custom ports (overrides configuration)
  • "-m" : Set number of threads (Default value : 1)
  • "-l" : Set log level
    • "-l 1" : Log level DEBUG
      • Will print everything including debugging logs
    • "-l 2" : Log level INFO
      • Prints every normal information
    • "-l 4" : Log level WARNING
      • Only prints warning and errors
    • "-l 5" : Log level ERROR
      • Only prints errors
    • "-l 6" : Log level CRITICAL
      • Doesn't print anything since Cameradar can't have critical failures right now, however you can use this level to debug your own code easily or if you add new critical layers
  • "-d" : Launch the discovery tool
  • "-b" : Launch the dictionary attack tool on all discovered devices
    • Needs either to be launched with the -d option or to use an advanced cache manager (DB, file, ...) with data already present
  • "-t" : Generate thumbnails from detected cameras
    • Needs either to be launched with the -d option or to use an advanced cache manager (DB, file, ...) with data already present
  • "-g" : Check if the stream can be opened with GStreamer
    • Needs either to be launched with the -d option or to use an advanced cache manager (DB, file, ...) with data already present
  • "-v" : Display Cameradar's version
  • "-h" : Display this help
  • "--gst-rtsp-server" : Use this option if the attack does not seem to work (only detects the username but not the path, or the opposite). This option will switch the order of the attacks to prioritize path over credentials, which is the way priority is handled for cameras that use GStreamer's RTSP server.

Ad-LDAP-Enum - Active Directory LDAP Enumerator


ad-ldap-enum is a Python script that was developed to discover users and their group memberships from Active Directory. In large Active Directory environments, tools such as NBTEnum were not performing fast enough. By executing LDAP queries against a domain controller, ad-ldap-enum is able to target specific Active Directory attributes and build out group membership quickly.
ad-ldap-enum outputs three tab delimited files 'Domain Group Membership.tsv', 'Extended Domain User Information.tsv', and 'Extended Domain Computer Information.tsv'. The first file contains users, computers, groups, and their memberships. The second file contains users and extra information about the users from Active Directory (e.g. a user's home folder or email address). The third file contains devices in the Domain Computers group and extra information about them from Active Directory (e.g. operating system type and service pack version).
ad-ldap-enum supports both authenticated and unauthenticated LDAP connections. Additionally, ad-ldap-enum can process nested groups and display a user's actual group membership.

Requirements
The package python-ldap is required for the script to execute. This can be installed with the following command:
pip install python-ldap

Usage
ad-ldap-enum.py [-h] -l LDAP_SERVER -d DOMAIN [-a ALT_DOMAIN] [-e] [-n] [-u USERNAME] [-p PASSWORD] [-v]

Active Directory LDAP Enumerator

optional arguments:
-h, --help show this help message and exit
-v, --verbose Display debugging information.
-o FILENAME_PREPEND, --prepend FILENAME_PREPEND Prepend a string to all output file names.

Server Parameters:
-l LDAP_SERVER, --server LDAP_SERVER IP address of the LDAP server.
-d DOMAIN, --domain DOMAIN Authentication account's FQDN. If an alternative domain is not specified this will be also used as the Base DN for searching LDAP.
-a ALT_DOMAIN, --alt-domain ALT_DOMAIN Alternative FQDN to use as the Base DN for searching LDAP.
-e, --nested Expand nested groups.

Authentication Parameters:
-n, --null Use a null binding to authenticate to LDAP.
-u USERNAME, --username USERNAME Authentication account's username.
-p PASSWORD, --password PASSWORD Authentication account's password.

Example
python ad-ldap-enum.py -d contoso.com -l 10.0.0.1 -u Administrator -p P@ssw0rd

Assorted Links


gdbgui - A browser-based frontend/gui for GDB


A modern, browser-based frontend to gdb (gnu debugger). Add breakpoints, view stack traces, and more in C, C++, Go, and Rust! Simply run gdbgui from the terminal and a new tab will open in your browser. 


Install
[sudo] pip install gdbgui --upgrade
Since gdbgui is under active development, consider running this command fairly often.


Run
gdbgui [binary to debug]
A new tab in your browser will open with gdbgui in it.


Features
  • Debug a different program in each tab (new gdb instance is spawned for each tab)
  • Set/remove breakpoints
  • View stack, threads
  • Switch frame on stack, switch between threads
  • Inspect memory in hex/character form
  • View all registers
  • Dropdown of all files used to compile binary, with autocomplete functionality
  • Source code explorer with ability to jump to line
  • Show assembly next to source code, highlighting current instruction. Can also step through instructions.


Why gdbgui?
  • Actively developed and compatible with the latest version of gdb (7.12)
  • Does only one thing: debugs programs. No integrated build system, no project settings, nothing to make things more complicated than they need to be. Just a lightweight frontend.
  • Design influenced by the amazing Chrome debugger: source code on the left, side panel on the right with collapsable widgets, console on the bottom
  • Full gdb command line utility built in
  • Written in widely used languages (Python and JavaScript)
  • Open source and free

Examples
See https://github.com/cs01/gdbgui/tree/master/examples


Arguments
Positional arguments:
command : (Optional) The binary and arguments to run in gdb. This is a way to script the intial loading of the inferior binary you wish to debug. For example gdbgui ./mybinary -myarg -flag1 -flag2 . Binaries and arguments can also be input through the browser interface after launching.
Flags (all are optional):
-h, --help show this help message and exit
-p PORT , --port PORT
The port on which gdbgui will be hosted
--host HOST The host ip address on which gdbgui serve.
-g GDB , --gdb GDB
Path to gdb executable or lldb-mi executable. Defaults is 'gdb'. lldb support is experimental and not fully functional at this time.
-v, --version Print version
--debug The debug flag of this Flask application. Pass this flag when debugging gdbgui itself to automatically reload the server when changes are detected
-n, --no_browser
By default, the browser will open with gdb gui. Pass this flag so the browser does not open.

Compatibility
Python versions: 2.7, 3.4, 3.5, pypy
Operating systems: Ubuntu 14.04, Ubuntu 16.04, OSX
Browsers: Chrome, Firefox, Ubuntu Web Browser
Gdb: 7.7.1 (tested), 7.12 (tested), likely works with intermediate versions


How Does it Work?
It uses Python to manage gdb as a subprocess. Specifically, the pygdbmi library , which returns key/value pairs (dictionaries) that can be used to create a frontend. To make a usable frontend, first a server must made to interface with gdb. In this case, the Flask server is used, which does three things: creates a managed gdb subprocess with pygdbmi, spawns a separate thread to constantly check for output from the gdb subprocess, and creates endpoints for the browser including http requests and websocket connections.
As output is parsed in the reader thread, it is immediately sent to the frontend through the websocket. As the browser receives these websocket messages, it maintains the state of gdb (whether it's running, paused, or exited, where breakpoints are, what the stack is, etc.) and updates the DOM as appropriate. The browser also sends commands to gdb through a websocket to Flask server, which then passes the command to gdb. Gdb writes new output, which is picked up by the reader thread.
gdbgui was designed to be easily hackable and extendable. There is no build system necessary to run or develop this app.
The main components of gdbgui are
  1. backend.py : The backend consists of a single Python file, which makes use of pygdbmi to interact with a gdb subprocess, and Flask to set up url routing, websockets, and http responses.
  2. gdbgui.pug : HTML file that defines the frontend
  3. gdbgui.js : The majority of the application is contained in this file. It dynamically updates the page, and maintains gdb state. It sends AJAX requests and uses websockets to interact with gdb through the server, then gets the response and updates the DOM as necessary.
  4. gdbgui.css : css stylesheet


Screenshots
Enter the binary and args just as you'd call them on the command line. Binary is restored when gdbgui is opened at a later time.


Intuitive control of your program. From left to right: Run, Continue, Next, Step, Return, Next Instruction, Step Instruction, send interrupt signal (SIGINT) to inferior process.


Stack/Threads
View all threads, the full stack on the active thread, the current frame on inactive threads. Switch between frames on the stack, or threads by pointing and clicking.


Source Code
View source, assembly, add breakpoints. All symbols used to compile the target are listed in a dropdown above the source code viewer, and have autocompletion capabilities.


With assembly. Note the bold line is the current instruction that gdb is stopped on.


Variables and Expressions
All local variables are automatically displayed, and are clickable to explore their fields.


Arbitrary expressions can be evaluated as well.


Expressions record their previous values, and can be displayed in an x/y plot.


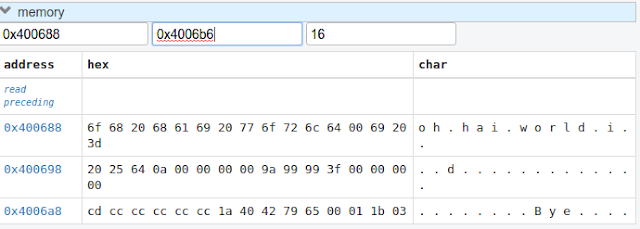
Memory Viewer
All hex addresses are automatically converted to clickable links to explore memory. Length of memory is configurable. In this case 16 bytes are displayed per row.


Registers
View all registers. If a register was updated it is highlighted in yellow.


gdb console
Read gdb output, and write to the gdb subprocess as desired. Don't let any gdb commandline skills you've developed go to waste.


gdbgui at launch:


ScratchABit - Easily retargetable and hackable interactive disassembler with IDAPython-compatible plugin API


ScratchABit is an interactive incremental disassembler with data/control flow analysis capabilities. ScratchABit is dedicated to the efforts of the OpenSource reverse engineering community (reverse engineering to produce OpenSource drivers/firmware for hardware not properly supported by vendors).
ScratchABit supports well-known in the community IDAPython API to write disassembly/extension modules.
ScratchABit is a work in progress, features are added on as needed basis, contributions are welcome.
ScratchABit is released under the terms of GNU General Public License v3 (GPLv3).

Requirements/manifesto
  1. Should not be written in an obfuscated language. These includes languages which are too low-level, which allow to access non-initialized variables, which don't differentiate between variables and functions/procedures, which start array indexes from arbitrary numbers, etc., etc. ScratchABit is written in Python (modern version, Python3) for your pleasure and sanity.
  2. User interface framework should allow user interaction of the needed level, not add dependencies, bloat, issues, and incompatibilities between framework's versions. ScratchABit currently uses simple (no color even) full-screen text user interface, using ANSI/VT100 terminal escape sequences (yes, even curses library was deemed too bloat a dependency to force upon users).
  3. Should leverage easy to use text formats to store "database", to facilitate easy reuse and tool writing, and storage in version control systems.

Quick start
To use ScratchABit, you need Python3 installed and VT100 (minimum) or XTerm (recommended) terminal or terminal emulator (any Unix system should be compliant, like Linux/BSD/etc., see FAQ below for more).
Clone the code using:
git clone --recursive https://github.com/pfalcon/ScratchABit
If you cloned code without --recursive , run git submodule update --init .
If you want to disassemble a file in self-describing executable format (like ELF), just pass it as an argument to ScratchABit.py . The repository includes example-elf (x86 32bit) for quick start:
python3 ScratchABit.py example-elf
Alternatively, if you want to disassemble a raw binary file, you need to create a .def (definition) file, to specify what memory areas are defined for the code, at which address to load binary file, etc. (Note: a .def file may be useful for .elf and similar files too.) The repository includes a simple x86_64 raw binary code, and the corresponding .def file:
python3 ScratchABit.py example.def
Press F1 if in doubt what to do next (ScratchABit works similarly to other interactive dissamblers; some previous experience or background reading may be helpful). Press F9 to access menus (mouse works too in XTerm-compatible terminals).

Using Plugins
IDAPython processor plugins can be loaded from anywhere on the Python module path. Alternatively, you can symlink the plugin .py file into the plugins/cpu/ subdirectory.
After the plugin is made available, create a new definition file based on example.def that sets the plugin module name in the cpu xxx line.
For a very simple example that uses an external plugin, see this esp8266.def file that works with the xtensa.py plugin from the ida-xtensa2 repository .

TODO/Things to decide
  • Currently uses multiple files for "database", each storing particular type of information. Switch to a single YAML file instead?
  • Add color (low priority, (unbloated!) patches welcome).
  • Few important UI commands to implement yet for comfortable work. ( All the most important commands should be there, other functionality is expected to be implemented using plugins).
  • Offer to save DB on quit if modified.
  • Git integration for DB saving.
  • Improve robustness (add exception handler at the main loop level, don't abort the application, show to user/log and continue).
  • Try to deal with code flow inconsistencies (e.g. within an instruction
    • low priority for intended usage) and data access inconsistencies (e.g. accessing individual bytes of previosly detected word - higher priority). (Improved in 1.4.)
  • See how to support other types of IDAPython plugins besides just processor modules.
  • Parse and use debugging information (e.g. DWARF) present in ELF (etc.) files.

FAQ
Q: What processors/architectures are supported?
A: ScratchABit doesn't support any processor architectures on its own, it is fully retargettable using IDAPython API plugins. Many plugins are available, writing a new plugin is easy. To let users test-drive ScratchABit, a very simple (!) X86 processor plugin is included in the distribution, using Pymsasid disassembler under the hood.
Q: I'm not on Linux, how can I run ScratchABit?
A: Install Linux in an emulator/VM on your system and rejoice.


[Charles] Web Debugging Proxy Application


Charles is a web proxy (HTTP Proxy / HTTP Monitor) that runs on your own computer. Your web browser (or any other Internet application) is then configured to access the Internet through Charles, and Charles is then able to record and display for you all of the data that is sent and received.

In Web and Internet development you are unable to see what is being sent and received between your web browser / client and the server. Without this visibility it is difficult and time-consuming to determine exactly where the fault is. Charles makes it easy to see what is happening, so you can quickly diagnose and fix problems.

Charles makes debugging quick, reliable and advanced; saving you time and frustration!

Key Features

  • SSL Proxying – view SSL requests and responses in plain text
  • Bandwidth Throttling to simulate slower Internet connections including latency
  • AJAX debugging – view XML and JSON requests and responses as a tree or as text
  • AMF – view the contents of Flash Remoting / Flex Remoting messages as a tree
  • Repeat requests to test back-end changes
  • Edit requests to test different inputs
  • Breakpoints to intercept and edit requests or responses
  • Validate recorded HTML, CSS and RSS/atom responses using the W3C validator